XAUUSD Classic Bullish Divergence & XAUUSD Hidden Bullish Divergence
When it comes to bullish divergence there are two bullish divergence trading setups mainly traded in the xauusd market - these xauusd setups are; Gold Classic Bullish Divergence and XAUUSD Hidden Bullish Divergence.
XAUUSD Classic Bullish Divergence
Classic bullish divergence set-up forms when price is forming lower lows ( LL ), but the oscillator is making higher lows (HL). The example illustrated & shown below shows a picture of this xauusd setup.
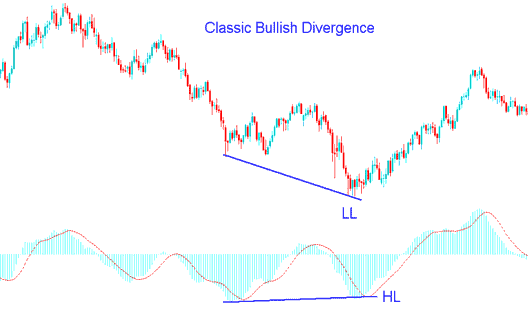
XAUUSD Classic Bullish Divergence - Bullish Divergence XAUUSD
This example uses MACD indicator as a XAUUSD Trading divergence indicator.
From the above bullish divergence example the gold price made a lower low(LL) but the indicator made a higher low(HL), this shows there is a divergence between the gold price & the indicator. This signal warns of a possible xauusd trend reversal.
Classic bullish diverging trading signal warns of a possible change in xauusd trend from down to up. This is because even though the gold price went lower the volume of sellers who pushed the gold trading price lower was less as illustrated by the MACD technical indicator. This indicates underlying weakness of the downwards gold trend.
Gold Hidden Bullish Divergence
This bullish divergence setup happens when price is forming a higher low ( HL ), but the oscillator (indicator) is showing a lower low (LL). To remember them easily think of them as W-shapes on Chart patterns. It occurs when there is a retracement in an upwards gold trend.
The bullish divergence example shown below shows an image of this xauusd setup, from the screenshot the gold trading price made higher low (HL) but the indicator made a lower low (LL), this shows that there was a diverging signal between the gold price and indicator. This signal shows that soon the xauusd market up xauusd trend is going to resume. In other words it shows this was just a retracement in an upwards xauusd trend.
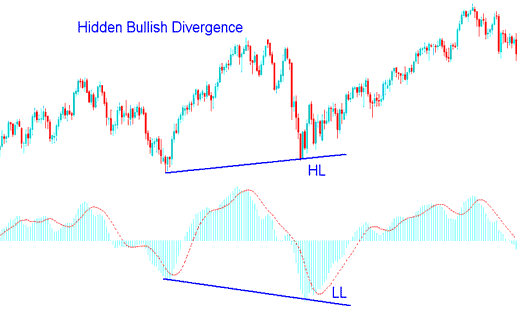
XAUUSD Hidden Bullish Divergence- Bullish Divergence XAUUSD
This bullish divergence confirms that a retracement move is complete and indicates underlying strength of an upward gold trend.


