How to Add Pivot Points Indicator in MT4 CFDs Charts
Step 1: Open Navigator Window on CFD Trading Software
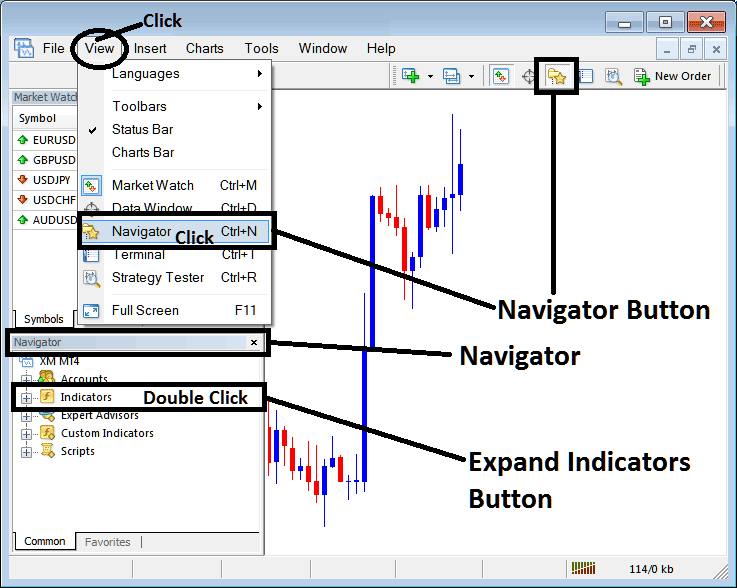
Open Navigator panel as shown and illustrated below: Navigate to "View" menu (click on it), then select "Navigator" window (click), or From Standard Toolbar click the "Navigator" button or press key-board short-cut keys "Ctrl+N"
On Navigator window, select 'Technical Indicators', (Double-Click)
How to Add Pivot Points Indicator in MT4 - MT4 Pivot Points Technical Indicator
Step 2: Expand the Indicators Menu on the Navigator - Adding Pivot Points MT4 Indicator
Expand the menu by clicking the expand button marker (+) or double click the "indicators" menu, after this the button will appear as (-) and will now display a list as shown below - select the Pivot Points cfds chart indicator from this list of cfds indicators so as to add the Pivot Points indicator on the cfd trading chart.
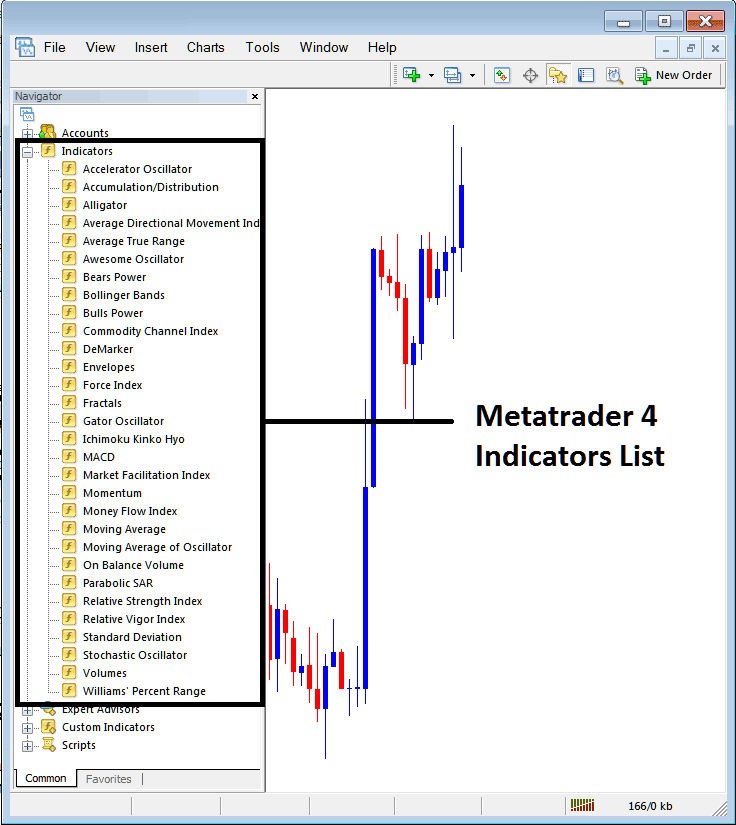
How to Add Pivot Points Indicator - From the Above window you can then place Pivot Points indicator that you want on the CFDs chart
How to Add Custom Pivot Points CFDs Indicator to MT4
If the technical indicator you want to add is a custom indicator - for example if the Pivot Points technical indicator you want to add is a custom indicator you will need to first add this custom Pivot Points indicator on the MT4 software & then compile the custom Pivot Points indicator so that the newly added Pivot Points custom indicator appears on the list of custom indicators on the MT4 platform.
To learn how to install Pivot Points indicators on MT4, how to add Pivot Points indicator window to MT4 and how to add Pivot Points custom indicator on MetaTrader 4 - How to add a custom Pivot Points indicator in MT4.
About Pivot Points Technical Indicator Tutorial Explained
Pivot Points Technical Analysis and Pivot Points Trading Signals
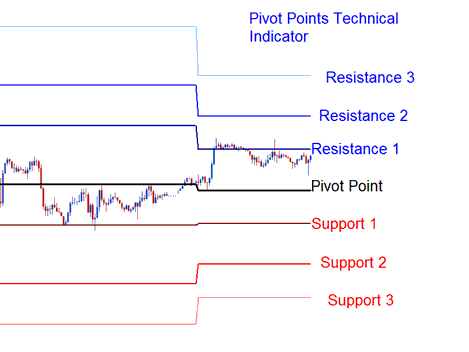
This indicator consists of a central pivot which is surrounded by 3 resistance levels above and 3 support levels below.
Initially these points were used by floor traders to analyze & trade the equities and futures exchange markets. This technical indicator is considered to be leading rather than lagging.
Pivots provide a quick way for cfds traders to analyze the general trend of how the market is going to be moving during the course of the day. A few simple calculations are used to plot the resistance and support levels.
To calculate these points for the coming trading day is the previous day's
- high,
- low, and
- close prices are used
The CFDs trading day closes at 5:00PM EST this daily market closing time is when the technical indicator is updated.
The 24-hour cycle for this indicator are calculated using a complex formula. The central pivot is then used to calculate the support & resistance areas as follows:
Resistance 3
Resistance 2
Resistance 1
Pivot Point
Support 1
Support 2
Support 3
CFD Technical Analysis and How to Generate Trading Signals
This indicator can be used in different ways to generate CFDs signals. The following techniques are the most common technical analysis:
Trend Identification Signals
The central pivot is used by traders to determine the general market trend direction. The trades taken will only be in the direction of the market trend.
- Buy signal - price is above the central point
- Sell signal - price is below the central point
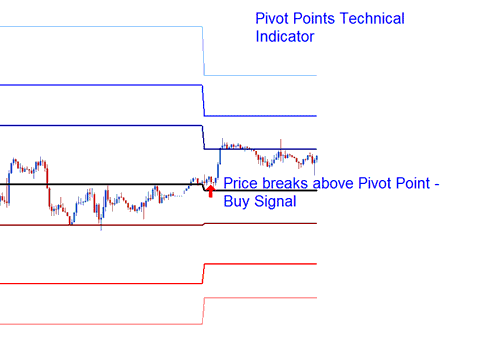
Price Breakout Signals
Price breakout signals are generated as follows
- Buy signal - is generated when the price breaks-out upwards through the central point.
- Sell signal - is generated when price breaks-out downward through the central point.
Price Breakout
Price Reversal Signal
Price reversals are generated as follows
Buy CFD Signal- when price moves downward towards one of the support level, then touches support or moves slightly through it then quickly reverses & moves upwards.
Sell Trading Signal- when price moves upward towards one of the resistance area, then touches resistance or moves slightly through it then quickly reverses & moves downwards.
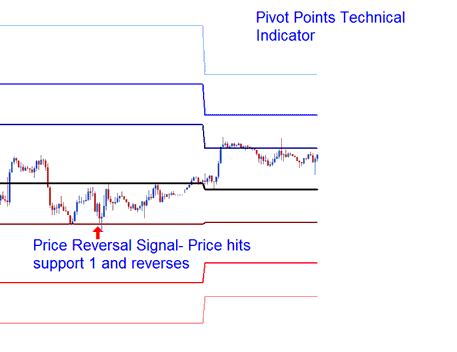
Price Reversal Signal
Setting Stoploss and Limit Profit Values
The central pivot & the other support & resistance zones are used by traders to determine suitable stop loss and limit profit levels.
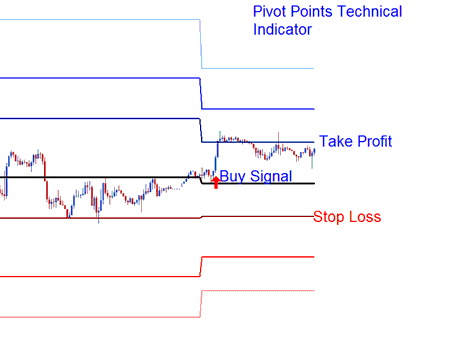
Setting Stoploss & Limit Profit
If a buy is placed above the central point the Resistance 1 or Resistance 2 can be used to set the take profit level, & the Support 1 can be set as a Stop-Loss Level for the trade.
To download Pivot points:
https://c.mql5.com/21/9/pro4x_pivot_lines.mq4
Once you download it open it with MQL4 Language Meta Editor, Then Compile the technical indicator by pressing Compile Button and it'll be added to your MT4.
Note: Once you add it to your MT4, the technical indicator has additional lines named MidPoints, to remove the additional lines open MQL4 Meta Editor(short cut key-board key - press F4), & change line 16 from:
Extern bool midpivots = true:
To
Extern bool midpivots = false:
Then Press Compile button again, & it will then appear as exactly illustrated on this web site.


