How to Add Inertia Indicator in MT4 Charts - Adding MT4 Inertia CFDs Chart Indicator
Step 1: Open Navigator Window Panel on CFDs Trading Software
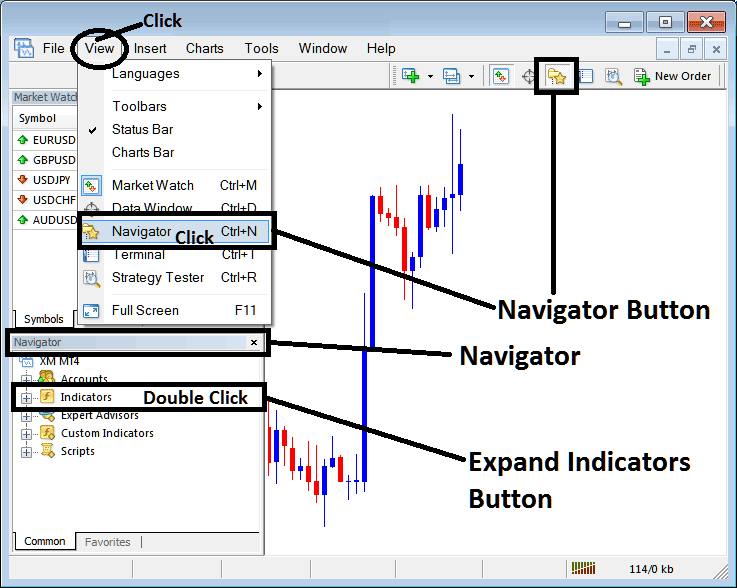
Open Navigator window panel as illustrated below: Navigate to 'View' menu (click on it), then select 'Navigator' window panel (click), or From Standard Toolbar click the 'Navigator' button key or press keyboard shortcut key 'Ctrl+N'
On Navigator window, choose 'Technical Indicators', (Double-Click)
How to Add Inertia Indicator in MT4 - MT4 Inertia Technical Indicator
Step 2: Expand the Indicators Menu on the Navigator - Adding Inertia MT4 Chart Indicator
Expand the menu by clicking the expand button marker (+) or double click the 'indicators' menu, after this the button will appear as (-) and will now display a list as shown below - select the Inertia cfds chart indicator from this list of cfds indicators so as to add the Inertia indicator on the cfd chart.
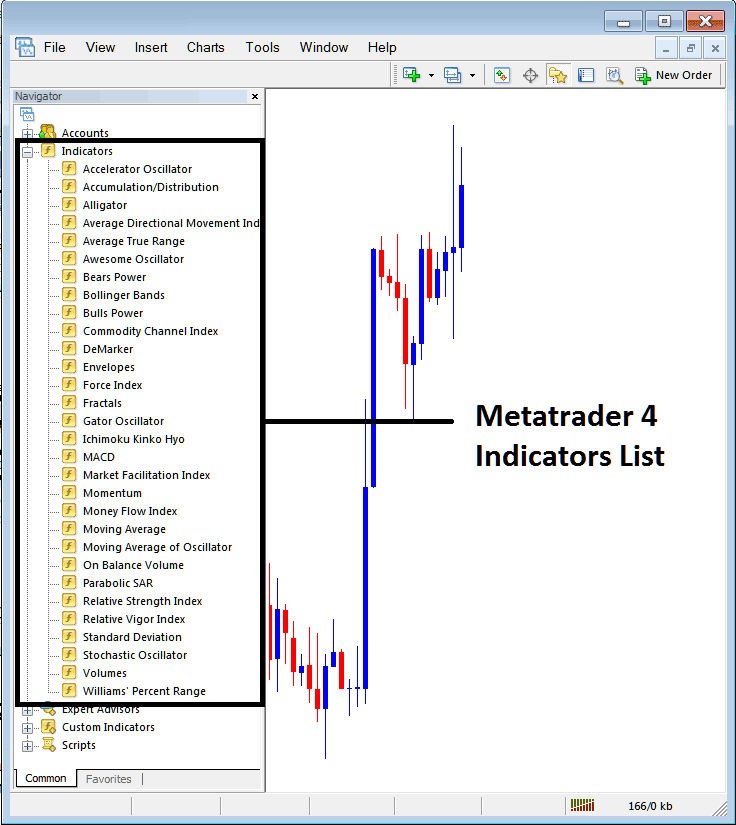
How to Add Inertia Indicator - From the Above window you can then place Inertia indicator that you want on the CFDs chart
How to Add Custom Inertia Indicator to MT4
If the technical indicator you want to add is a custom indicator - for example if the Inertia technical indicator you want to add is a custom indicator you will need to first add this custom Inertia indicator on the MetaTrader 4 software & then compile the custom Inertia indicator so that the newly added Inertia custom indicator pops up on the list of custom indicators in MetaTrader 4 software.
To learn how to install Inertia indicators on MT4, how to add Inertia indicator window to MT4 and how to add Inertia custom indicator in MT4 - How to add a custom Inertia indicator in MT4.
About Inertia Technical Indicator Explained
Inertia Technical Analysis and Inertia Trading Signals
Developed by Donald Dorsey and was originally used to trade Stocks & Commodities market, before cfds traders took it & started trading the cfds market using this indicator.
Dorsey chose to name it "Inertia" because of his interpretation of the market trend. He claimed that a cfds market trend is the overall result of inertia and thus it takes more momentum for a trending market to reverse its direction than to continue moving in the same direction. Therefore, a CFDs trend is the measurement of market inertia. This is an oscillator that uses the scale of zero to a hundred. Signals are generated using the 50 level center line crossover method.
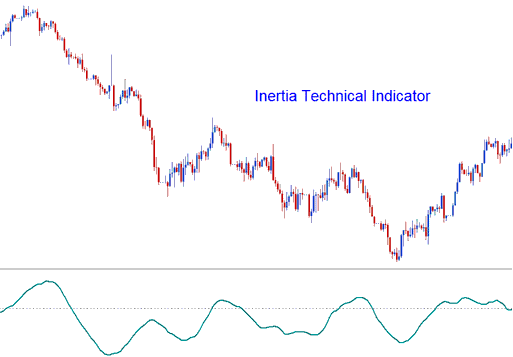
In physics, the term Inertia is defined in terms of mass and direction of motion. Using standard technical analysis, the direction of motion of the trend can be easily defined. However, the mass cannot be easily defined. Dorsey claimed that the volatility of a financial instrument might be the simplest & the most accurate measurement of inertia. This theory led to the use of the Relative Volatility Index (RVI) as the basis to be used as a trend technical indicator. Therefore Inertia technical indicator is comprised of: RVI smoothed by a linear regression.
CFD Technical Analysis and Generating Trading Signals
When it comes to trading the cfds market using this indicator, the signals generated are fairly simple to interpret. Below are 2 example illustrated using cfds charts showing how buy and sell signals are generated using Inertia.
Upward CFD Trend - Bullish Buy Trading Signal
If the Inertia is above 50, positive inertia is indicated, this therefore defines the long-term CFDs trend as upward as long as the indicator remains above 50. When it crosses to levels below 50 then this is interpreted as an exit signal. The chart below shows an example of how a buy signal is generated.
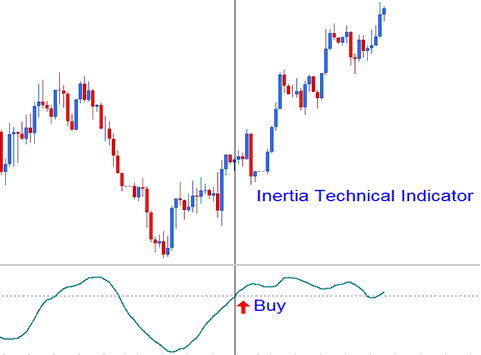
Upwards Trend - Bullish Signal
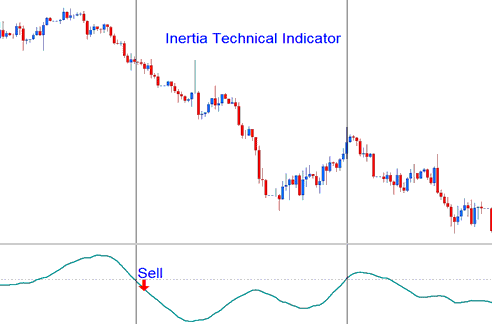
Downwards CFD Trend - Bearish Sell Trading Signal
If the Inertia is below 50, negative inertia is indicated, this therefore defines the long-term cfds trend as downwards as long as the indicator remains below 50. If it goes above 50 then this is interpreted as an exit signal. The cfds chart below shows how a sell signal generated.
Downwards Trend - Bearish Signal


