How to Add Ichimoku Kinko Hyo Indicator in MT4 Charts
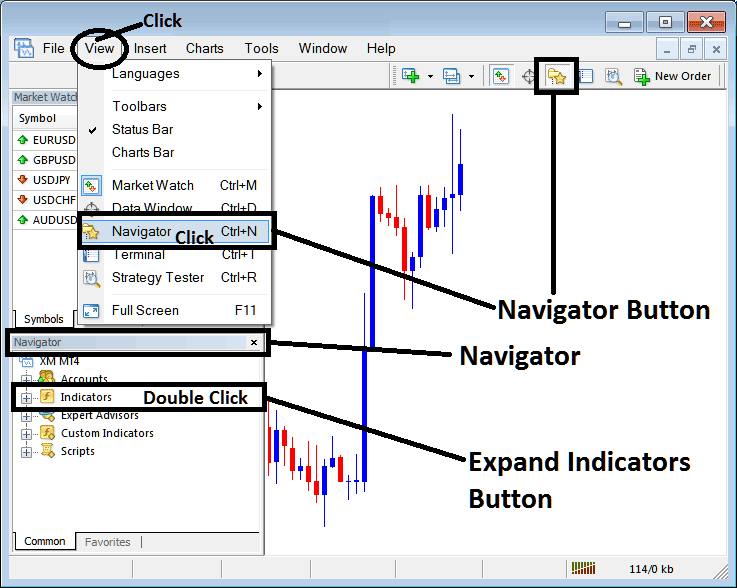
Step 1: Open Navigator Window on CFD Trading Software
Open Navigator panel as shown and illustrated below: Navigate to "View" menu (click on it), then select "Navigator" window (click), or From Standard Toolbar click the "Navigator" button or press key-board short-cut keys "Ctrl+N"
On Navigator window, select 'Technical Indicators', (Double-Click)
How to Add Ichimoku Kinko Hyo Indicator in MT4 - MT4 Ichimoku Kinko Hyo Technical Indicator
Step 2: Expand the Indicators Menu on the Navigator - Adding Ichimoku Kinko Hyo MT4 Indicator
Expand the menu by clicking the expand button marker (+) or double click the "indicators" menu, after this the button will appear as (-) and will now display a list as shown below - select the Ichimoku Kinko Hyo cfds chart indicator from this list of cfds indicators so as to add the Ichimoku Kinko Hyo indicator on the cfd trading chart.
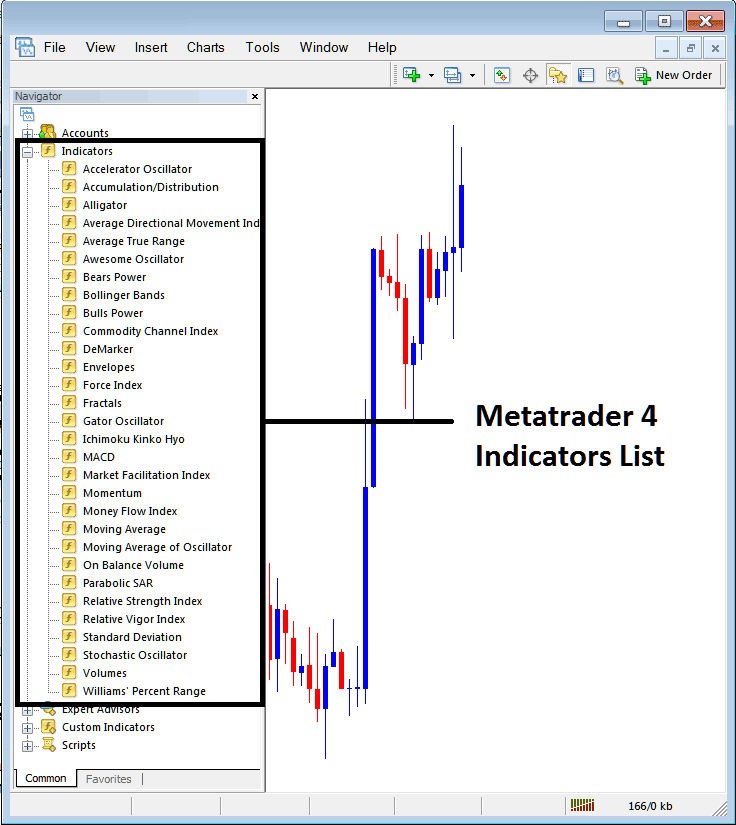
How to Add Ichimoku Kinko Hyo Indicator - From the Above window you can then place Ichimoku Kinko Hyo indicator that you want on the CFDs chart
How to Add Custom Ichimoku Kinko Hyo CFDs Indicator to MT4 Software
If the technical indicator you want to add is a custom indicator - for example if the Ichimoku Kinko Hyo technical indicator you want to add is a custom indicator you will need to first add this custom Ichimoku Kinko Hyo indicator on the MT4 software & then compile the custom Ichimoku Kinko Hyo indicator so that the newly added Ichimoku Kinko Hyo custom indicator appears on the list of custom indicators on the MT4 platform.
To learn how to install Ichimoku Kinko Hyo indicators on MT4, how to add Ichimoku Kinko Hyo indicator window to MT4 and how to add Ichimoku Kinko Hyo custom indicator on MetaTrader 4 - How to add a custom Ichimoku Kinko Hyo indicator in MT4.
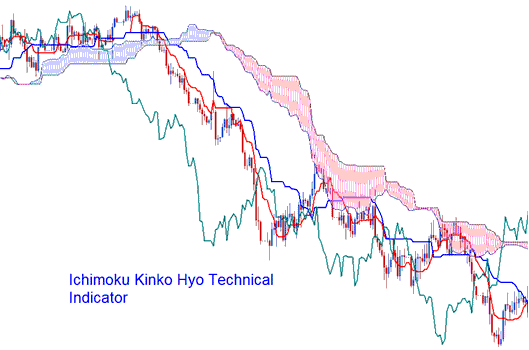
About Ichimoku Kinko Hyo Technical Indicator Explained
Ichimoku Kinko Hyo Technical Indicator
Ichimoku Kinko Hyo is a Japanese charting technique that was created before by a Japanese newspaper writer, with the pen name of Ichimoku Sanjin.
- Ichimoku means "a glance" or "one look"
- Kinko means "equilibrium" or "balance"
- Hyo is the Japanese word for "chart"
Thus, Ichimoku Kinko Hyo means, "a glance at an equilibrium chart". Ichimoku attempts to identify the likely direction of price and help the trader to figure out the most suitable time to enter or exit the market.
Calculation
This indicator consists of five lines plotted using the midpoints of previous highs and lows. The five lines are calculated as follows:
1) Tenkan-Sen: Conversion Line: Red Line (Highest High + Lowest Low) / 2, for the last 9 price periods
2) Kijun-Sen: Base Line: Blue Line (Highest High + Lowest Low) / 2, for the last 26 price periods
3) Chikou Span: Lagging Span: Green Line Today's closing price plotted 26 price periods behind
4) Senkou Span A: Leading Span A = (Tenkan-Sen + Kijun-Sen) / 2, plotted 26 price periods ahead
5) Senkou Span B: Leading Span B: (Highest High + Lowest Low) / 2, for the past 52 price periods, plotted 26 price periods ahead
Kumo: Cloud: area between Senkou Span A & B
CFD Technical Analysis and How to Generate Trading Signals
Bullish signal - Tenkan-Sen crosses Kijun-Sen from below.
Bearish signal - Tenkan-Sen crosses the Kijun-Sen from above.
However, there are different levels of strength for the buy & sell signals generated.
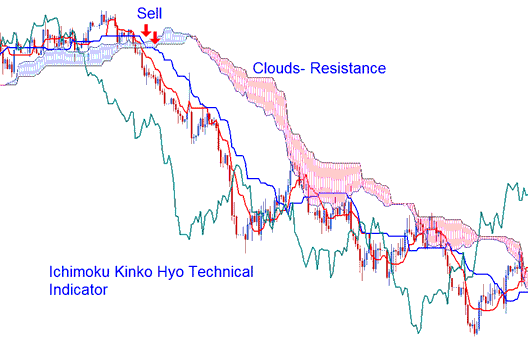
Technical Analysis in CFDs Trading
Bullish cross-over trading signal forms above the Kumo (clouds),
Very strong buy signal.
Bearish crossover trading signal forms below the Kumo (clouds),
Very strong sell signal.
If a bullish/ bearish crossover trading signal takes place within the Kumo (clouds) it's considered a medium strength buy or sell trading signal.
A bullish crossover that occurs below the clouds is considered a weak buy signal while a bearish cross-over that occurs above the clouds is considered a weak sell signal.
Support & Resistance Levels
Support & resistance levels can be predicted by the presence of Kumo (clouds). The Kumo can also be used to identify the current trend of the cfd market.
- If price is above the Kumo, the prevailing market trend is said to be upwards.
- If price is below the Kumo, the prevailing market trend is said to be downwards.
Chikou Span or Lagging Span is also used to determine the strength of the buy or sell signal.
- If the Chikou Span is below the closing price of the last 26 periods ago and a sell short signal is given, then the strength of the CFDs trend is downwards, otherwise the signal is considered to be a weak sell signal.
- If there is a bullish signal and the Chikou Span is above the price of the last 26 periods ago, then the strength of the trend is to the upside, otherwise it is considered to be a weak buy signal.


