How to Add DeMarker Indicator in MT4 Charts - Adding MT4 DeMarker CFDs Chart Indicator
Step 1: Open Navigator Window Panel on CFD Trading Software
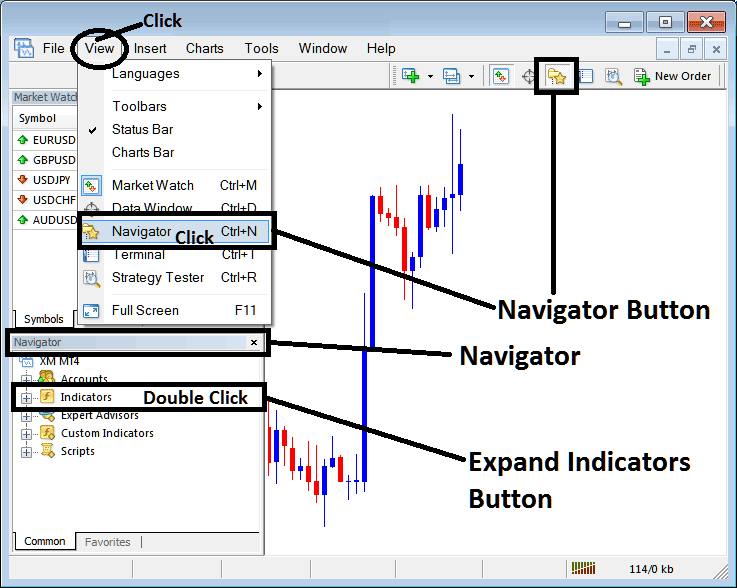
Open Navigator window panel as illustrated below: Navigate to 'View' menu (click on it), then select 'Navigator' window panel (click), or From Standard Toolbar click the 'Navigator' button key or press keyboard shortcut key 'Ctrl+N'
On Navigator window, choose 'Technical Indicators', (Double-Click)
How to Add DeMarker Indicator in MT4 - MT4 DeMarker Technical Indicator
Step 2: Expand the Indicators Menu on the Navigator - Adding DeMarker MT4 Chart Indicator
Expand the menu by clicking the expand button marker (+) or double click the 'indicators' menu, after this the button will appear as (-) and will now display a list as shown below - select the DeMarker cfds chart indicator from this list of cfds indicators so as to add the DeMarker indicator on the cfd chart.
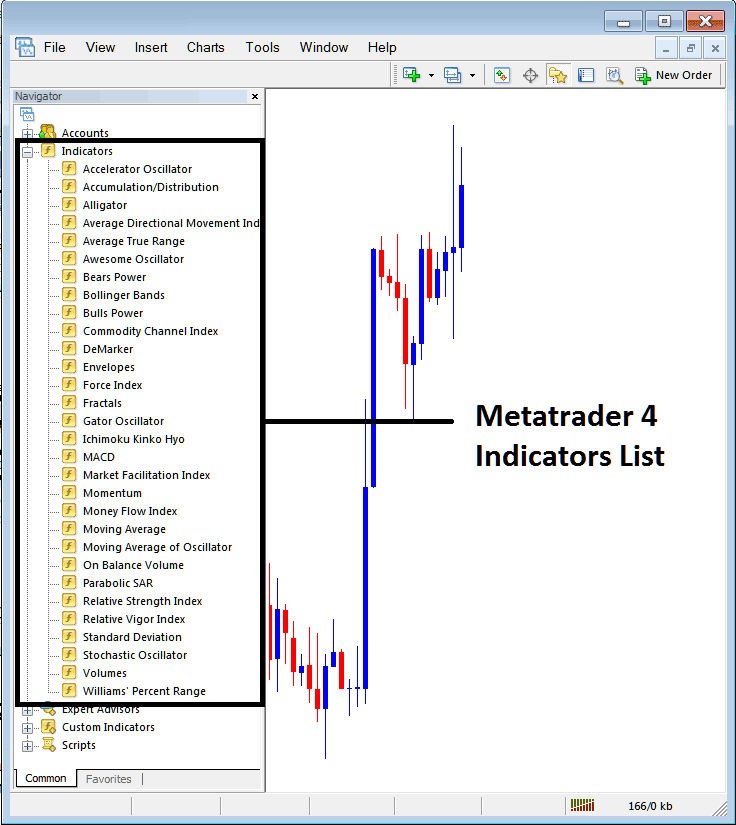
How to Add DeMarker Indicator - From the Above window you can then place DeMarker indicator that you want on the CFDs chart
How to Add Custom DeMarker Indicator to MT4
If the technical indicator you want to add is a custom indicator - for example if the DeMarker technical indicator you want to add is a custom indicator you will need to first add this custom DeMarker indicator on the MetaTrader 4 software & then compile the custom DeMarker indicator so that the newly added DeMarker custom indicator pops up on the list of custom indicators in MetaTrader 4 software.
To learn how to install DeMarker indicators on MT4, how to add DeMarker indicator window to MT4 and how to add DeMarker custom indicator in MT4 - How to add a custom DeMarker indicator in MetaTrader 4.
About DeMarker Technical Indicator Tutorial Explained
DeMarker Technical Analysis and DeMarker Trading Signals
Developed by Tom Demark.
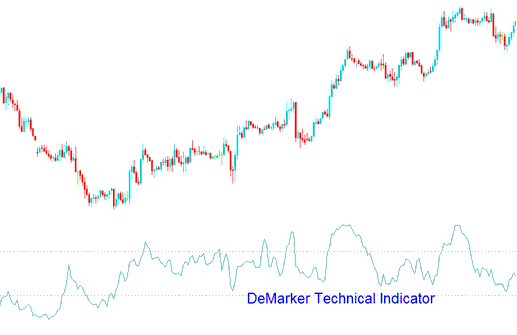
This indicator is designed to overcome the general shortcomings of traditional overbought & oversold technical indicators.
The DeMarker is used by traders to predict potential market bottoms and tops by utilizing price data comparisons from one bar to the next.
CFDs Technical Analysis and Generating Trading Signals
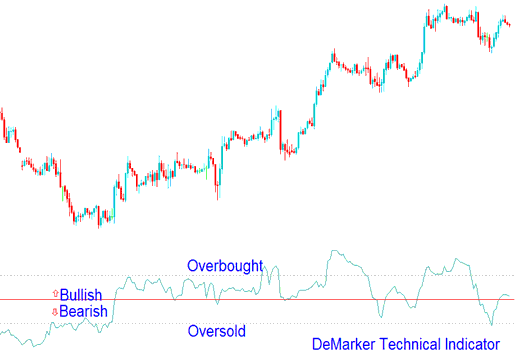
This indicator is interpreted in the same way as other overbought / oversold indicators. The overbought level is marked at 70 while oversold is marked at 30.
Bullish Reversal Signal - When the DeMarker falls below 30, the bullish price reversal should be expected.
Bearish Reversal Signal - When the DeMarker rises above 70, the bearish price reversal should be expected.
Technical Analysis in CFDs Trading
If you use longer time frames to plot the Demarker, you will get to catch the long term market trends. If you use the short time frame based on shorter periods you can enter the market at the point where the risk is minimum and you can plan the time of transaction so that it is within the major CFDs trend.


