How to Add Bollinger Percent B on MT4 Charts - Adding MT4 Bollinger Percent B Indicator
Step 1: Open Navigator Window Panel on CFDs Trading Software
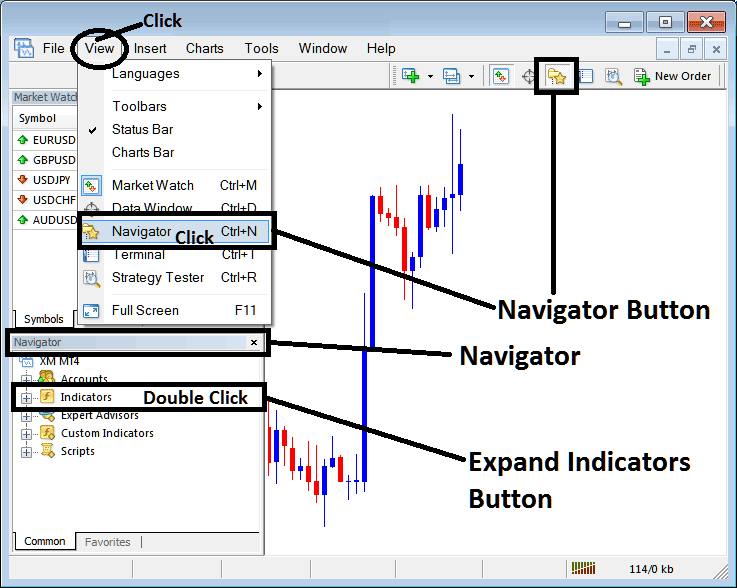
Open Navigator window panel as illustrated below: Navigate to 'View' menu (click on it), then select 'Navigator' window panel (click), or From Standard Toolbar click the 'Navigator' button key or press keyboard shortcut key 'Ctrl+N'
On Navigator window, choose 'Technical Indicators', (Double-Click)
How to Add Bollinger Percent B Indicator in MT4 - MT4 Bollinger Percent B Technical Indicator
Step 2: Expand the Indicators Menu on the Navigator - Adding Bollinger Percent B MT4 Indicator
Expand the menu by clicking the expand button marker (+) or double click the 'indicators' menu, after this the button will appear as (-) and will now display a list as shown below - select the Bollinger Percent B cfds chart indicator from this list of cfds indicators so as to add the Bollinger Percent B indicator on the cfd chart.
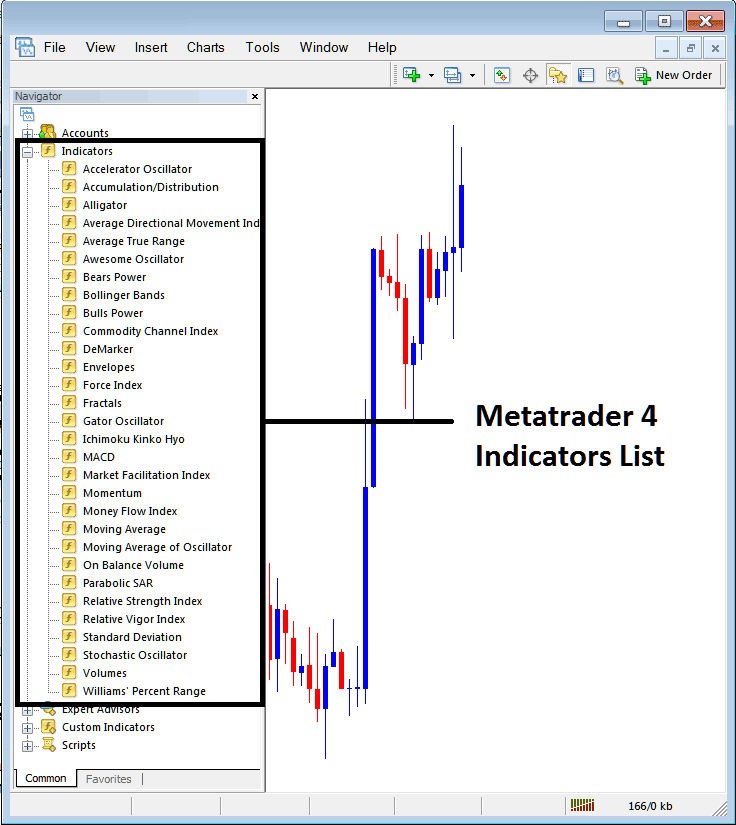
How to Add Bollinger Percent B Indicator - From the Above window you can then place Bollinger Percent B indicator that you want on the CFDs chart
How to Add Custom Bollinger Percent B Indicator to MT4
If the technical indicator you want to add is a custom indicator - for example if the Bollinger Percent B technical indicator you want to add is a custom indicator you will need to first add this custom Bollinger Percent B indicator on the MetaTrader 4 software & then compile the custom Bollinger Percent B indicator so that the newly added Bollinger Percent B custom indicator pops up on the list of custom indicators in MetaTrader 4 software.
To learn how to install Bollinger Percent B indicators on MT4, how to add Bollinger Percent B indicator window to MT4 and how to add Bollinger Percent B custom indicator in MT4 - How to add a custom Bollinger Percent B indicator in MT4.
About Bollinger Percent B Technical Indicator Explained
Bollinger Percent B CFDs Technical Analysis Trading Signals
Created by John Bollinger
Percentage B indicator is derived from Bollinger Bands.
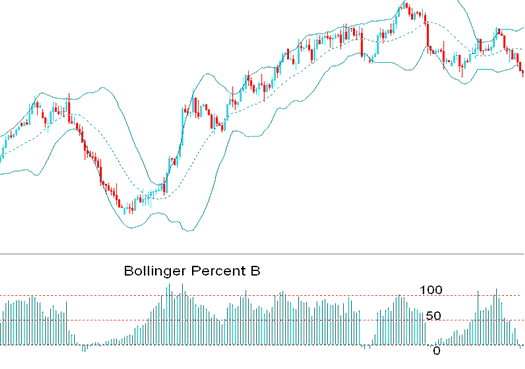
This is an oscillator which has Three lines - 0, 50, 100
- 0 represents lower Band
- 50 represents middle Band
- 100 represents upper Band
Percent B oscillates between these 3 points & it shows where the price is in relation to the Three Bollinger Bands.
%b indicator
When the price touches the upper band then the oscillator hits 100, if price moves above the upper band the oscillator moves to +100
When the price touches the lower band then the oscillator hits 0, if price moves below the lower band the oscillator moves to -0
When the price touches the middle band then the oscillator will be at 50.
Calculation
Percent B = CFDs Price Close - Lower Band * 100
Upper Band - Lower Band
CFD Trading Technical Analysis & How to Generate Trading Signals
Percent B indicates to what degree the price closes above or below any of the bands.
Buy Trading Signal
Oscillator values above 50 is a bullish signal.
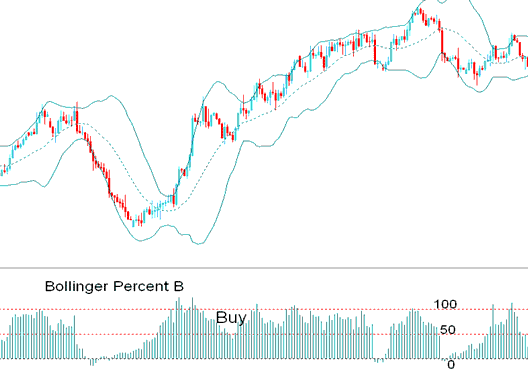
% b Bullish Buy Signal
Sell Trading Signal
Oscillator values below 50 is a bearish trading signal.
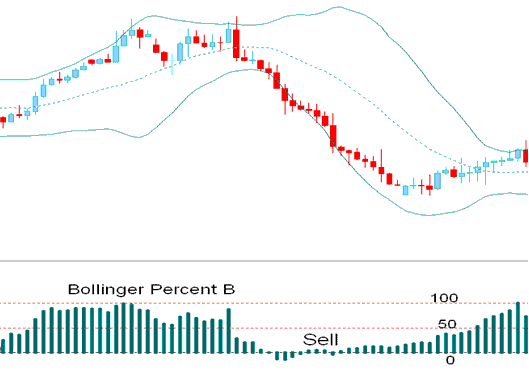
%b Bearish Sell Signal


