How to Add ATR Indicator in MT4 Charts - Adding MT4 ATR CFDs Chart Indicator
Step 1: Open Navigator Window on CFDs Trading Software
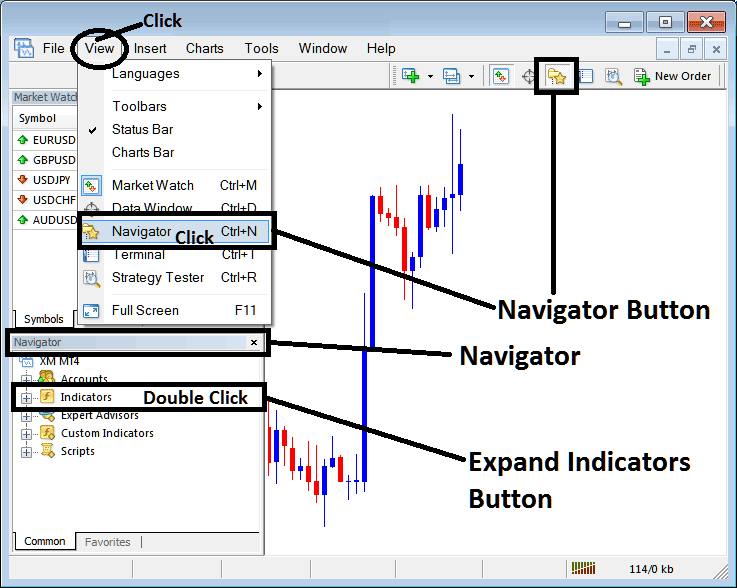
Open Navigator panel as shown and illustrated below: Navigate to "View" menu (click on it), then select "Navigator" window (click), or From Standard Toolbar click the "Navigator" button or press key-board short-cut keys "Ctrl+N"
On Navigator window, select 'Technical Indicators', (Double-Click)
How to Add ATR Indicator in MT4 - MT4 ATR Technical Indicator
Step 2: Expand the Indicators Menu on the Navigator - Adding ATR MT4 Chart Indicator
Expand the menu by clicking the expand button marker (+) or double click the "indicators" menu, after this the button will appear as (-) and will now display a list as shown below - select the ATR cfds chart indicator from this list of cfds indicators so as to add the ATR cfds indicator on the cfd trading chart.
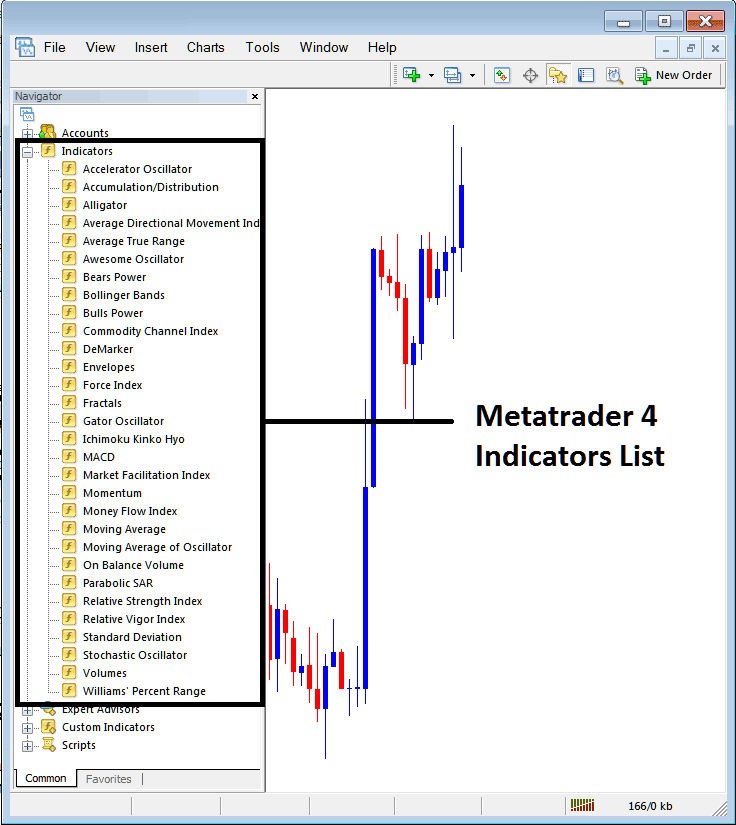
How to Add ATR Indicator - From the Above window you can then place ATR indicator that you want on the CFDs chart
How to Add Custom ATR Indicator to MT4
If the technical indicator you want to add is a custom indicator - for example if the ATR technical indicator you want to add is a custom indicator you will need to first add this custom ATR indicator on the MT4 software & then compile the custom ATR indicator so that the newly added ATR custom indicator appears on the list of custom indicators on the MT4 platform.
To learn how to install ATR indicators on MT4, how to add ATR indicator window to MT4 and how to add ATR custom indicator on MetaTrader 4 - How to add a custom ATR cfd indicator in MT4.
About ATR Technical Indicator Explained
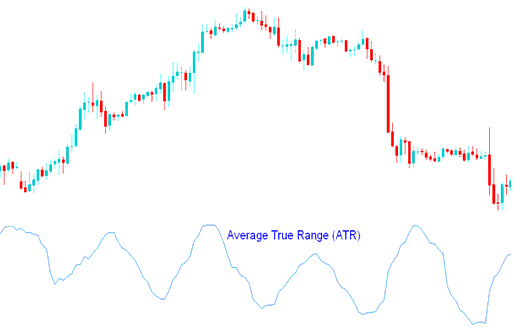
Average True Range - ATR Technical Analysis and ATR Trading Signals
Developed by J. Welles Wilder
This indicator is a measure of volatility - it measures the range of price movement for a particular price period. The ATR is a directionless indicator and it does not determine the direction of the CFDs trend.
High ATR values
High Average True Range values indicated market bottoms after a sell off.
Low ATR values
Low Average True Range values showed extended periods of sideways price movement- Price Range, such as those found at market tops and consolidation periods. Low ATR values are typical for the periods of sideways movement of long duration which happen at the top of the market and during consolidation.
Calculation
This technical indicator is calculated using the following:
- Difference between the current high and the current low
- Difference between the previous closing price & the current high
- Difference between the previous closing price & the current low
The final Average is calculated by adding these values and calculating the average.
CFD Technical Analysis and How to Generate Trading Signals
Average True Range technical indicator can be analyzed using the same principles as other volatility technical indicators.
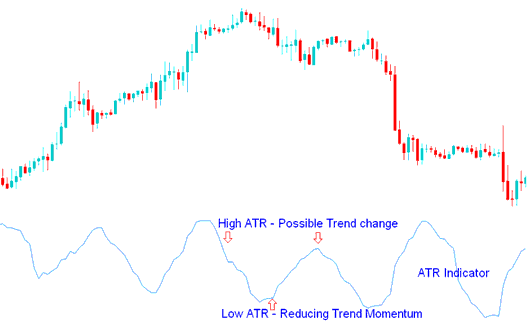
Possible trend change signal - The higher the value of indicator, the higher the probability of a trend change;
Measure of trend momentum - The lower the indicator’s value, the weaker the trend movement.
Technical Analysis in CFD Trading


