How Do You Interpret Inverse Head and Shoulders Chart Pattern?
CFD Trading Read Inverse Head and Shoulders Chart Pattern
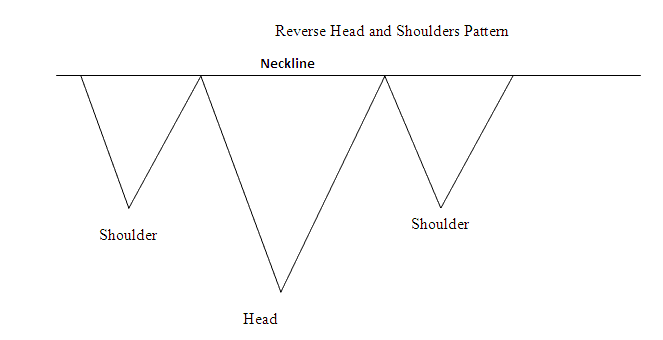
Inverse Head & Shoulders Pattern is a reversal chart pattern that is formed after an extended cfd downward trend move. Inverse head and shoulders chart pattern resembles an upside down head and shoulders chart pattern.
Inverse Head & Shoulders Chart Pattern is considered complete once the cfd price penetrates and moves above neckline - the neckline is drawn by joining the 2 cfd price peaks that are between the inverse shoulders.
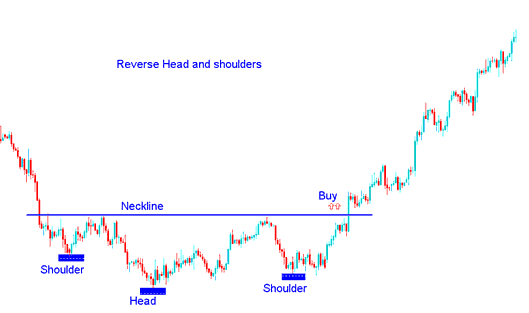
To open a buy cfd trade - traders place their buy stop pending orders just above the neck-line.
Summary: How Do You Interpret Inverse Head and Shoulders Chart Pattern?
- Inverse Head and Shoulders CFD Trading Chart pattern forms after an extended cfd downward trend move
- Inverse Head and Shoulders Chart Pattern signals that there will be a reversal in the downward cfd trend
- Inverse Head and Shoulders Pattern formation resembles an up-side down head & shoulders pattern - thus its name - Inverse Head & Shoulders Pattern.
- CFD traders will buy when price breaks-out above the neck line: as explained on the inverse head and shoulders chart pattern examples explained and illustrated below.
Analyze Inverse Head and Shoulders Chart Pattern?
Read Inverse Head and Shoulders Chart Pattern
How to Trade Inverse Head and Shoulders Chart Pattern?
How Do You Interpret Inverse Head & Shoulders Chart Pattern


