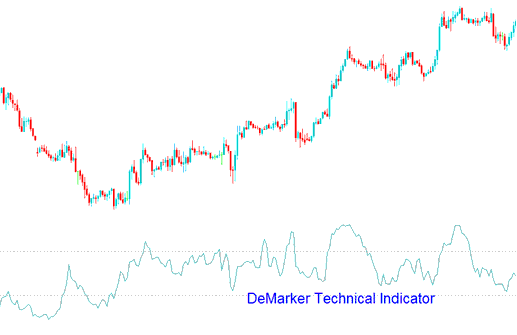
DeMarker Bitcoin Analysis & DeMarker Trade Signals
Developed by Tom Demark.
This btcusd indicator is designed to overcome the general shortcomings of traditional overbought and over-sold technical indicators.
Bitcoin traders use the DeMarker to estimate where the market might bottom out or peak by comparing bitcoin price information from one bar to another.

Bitcoin Analysis and How to Generate Signals
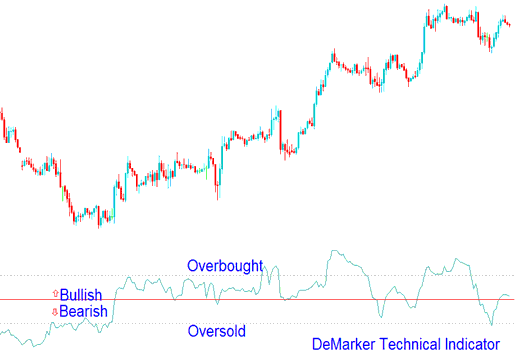
This BTCUSD tool works like other overbought or oversold signals. The overbought mark sits at 70, and oversold at 30.
Bullish Reversal Trade Signal - When DeMarker falls below 30, the bullish bitcoin price reversal should be expected.
Bearish signal hits at DeMarker over 70. Watch for bitcoin price drop.

Analysis in BTC USD Trading
By utilizing a longer time frame to draw the Demarker, you will be able to capture long-term market trends. Conversely, if you employ a shorter time frame based on brief periods, you can enter the btcusd market at a point where the risk is minimized and plan the timing of your transactions to align with the prevailing major Bitcoin trend.
Get More Lessons:
- MetaTrader 5 Software Insert Andrew's Pitch Fork, Charts Cycle Lines, BTC USD Chart Text Label in MT5 Platform
- Trade Setups for Divergence in BTCUSD
- Upwards BTC USD Channel Indicator on MetaTrader 4 BTCUSD Charts
- What are the Top BTCUSD Trading Strategies Guide Lesson?
- How Can You Trade Bitcoin & Set a Sell Stop BTCUSD Order in MT5 Platform/Software?
- How to Draw Candles Chart in Software
- Best MACD for 15-Minute Bitcoin Chart
- Where Do I Study How to Use MT4 Platform?
- Hidden Divergence Trading System: Comprehensive Tutorial Guide
- Types of Bitcoin Trade Setups
