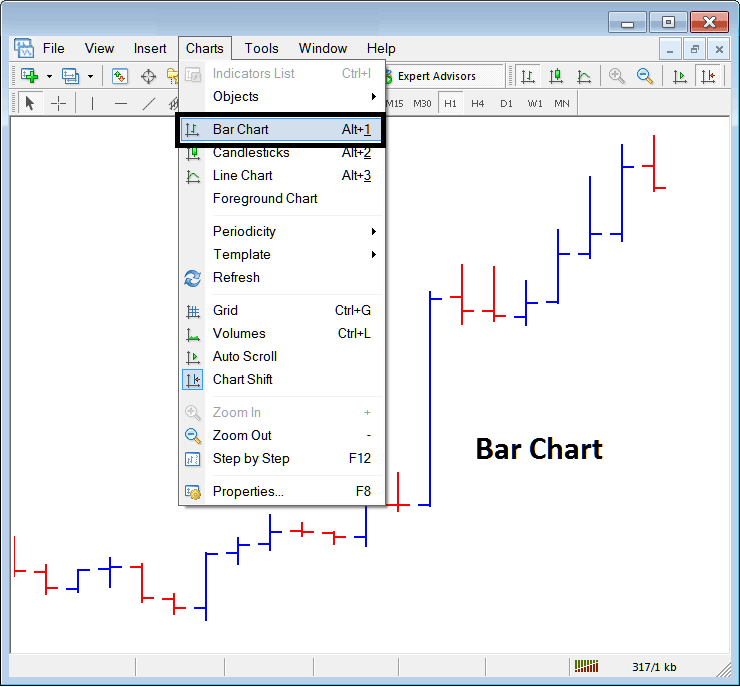
Drawing Bar Crypto Currency Charts on the MT4
The third option listed under the charts menu in the MetaTrader 4 platform is the "Bar Bitcoin Chart" button. This function allows the user to select the visualization method, displaying Bitcoin price movement using price bars.

When charting BTCUSD, a trader might opt for Bar Charts for the BTC USD crypto data. The menu button shown above illustrates how a user can select this visualization in MetaTrader 4.
These are indicated using color coding:
- Red bar - Bitcoin Price went down
- Blue bar - Bitcoin Price went up
These graphical bars also feature a horizontal marker on the left boundary and another on the right: these serve to indicate the starting price (left tick mark) and the ending price (right tick mark) respectively.
The highest point shows the high of the bitcoin price
Lowest point highlights the low of the bitcoin price
The four points Open, High, Close, and Low, collectively referred to as OHLC (an abbreviation of their initial letters), represent key levels on every single price bar in a trading chart.
These charts are not particularly favored by Bitcoin traders due to their lack of appeal in trading analysis, leading traders to prefer alternative types.
Discover More Directions & Instructional Material:
- Inverted Hammer Candlestick Pattern and Shooting Star Candlestick Pattern
- How Do I Download Bitcoin Trading MT5 on iPad?
- How Do I Analyze BTCUSD MT4 Upwards Bitcoin Channel in MT4 Platform Software?
- Downloading Metaquotes MetaTrader 5 for BTCUSD Trading
- MetaTrader 4 Open Real Account Guide of How to Open MT4 Real BTC USD Account
