How Do I Trade Forex Using USDX Chart
The US Dollar Index is a measure of the value of the United States Dollar relative to a basket of foreign currencies. It is a mean value of rate fluctuation of USD compared with the six major world currencies JPY, EUR, GBP, CAD, CHF and SEK.
This value is figured out by considering the values of the six most important global currencies: the Euro, Japanese Yen, Canadian Dollar, British Pound, Swedish Krona, and Swiss Franc. It began in March 1973 (after the start of the system of floating exchange rates, which is now called the Forex Market).
The index quote starts at a base of 100. That point sets the weighted dollar value.
It is also used by the US Federal Reserve System to calculate the trade and weighted index value. The weighted USDX is calculated in regards to the currencies of countries that form USA foreign international trade turnover. These countries are European Union 57.6%, Japan 13.6%, Great Britain 11.9%, Canada 9.1%, Sweden 4.2% and Switzerland 3.6%.
Consequently, this calculated figure represents the mean, weighted by importance, of the US currency's value relative to:
- Euro Zone, EUR - 57.6%
- Japan, JPY - 13.6%
- Great Britain, GBP -11.9%
- Canadian, CAD - 9.1%
- Swedish, SEK - 4.2%
- Swiss, CHF - 3.6%
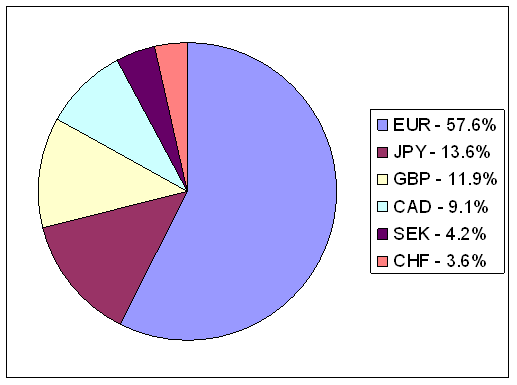
Basket of Weighted Currencies
When the USDX goes higher the US dollar gains more value compared to other currencies. If it goes up to 110 the value of USD exchange rates would have increased by 10%, if it went down to 90 then the value of USD exchange rates would have decreased by 10%. The highest level it has ever reached is 160 and the lowest level was 78.
This index updates when US markets run, from Sunday evening New York time to Friday afternoon. It calculates and refreshes based on current exchange rates.
Traders use this index chart to predict rates. It compares other pairs to the US dollar.
In the stock market, indexes like the Dow Jones, NASDAQ, and S&P show the market's overall health. In the forex market, the USDX tracks the general trend of currency rates.
USDX FORMULA
USDX=EUR * 0.576 x JPY * 0.136 x GBP * 0.119 x CAD * 0.091 x SEK * 0.042 x CHF * 0.036
After calculation, this result is overlaid onto the chart, serving traders as an essential indicator for the direction of the US Dollar currency pair.
- When the trend is moving downward it means traders are selling the Dollar
- When the trend is heading up it means exchange traders are buying the Dollar
The exemplification presented below shows a USDX chart, it is drawn the same way as the other currency charts.
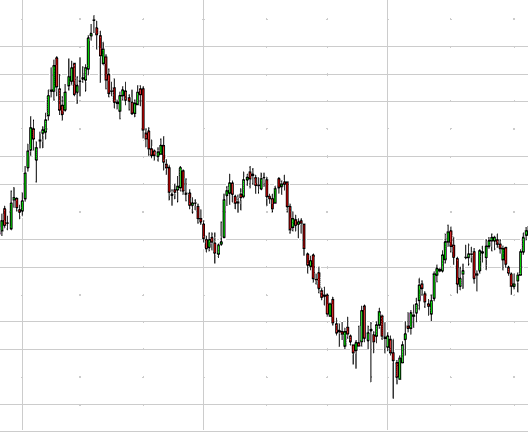
USDX
Technical Analysis of EURUSD using USDX
The chart representing the US Dollar index maintains an inverse correlation with EURUSD: this means their movements are opposing: when one rises, the other falls, and vice versa.
The exemplification laid-out below shows the EURUSD.
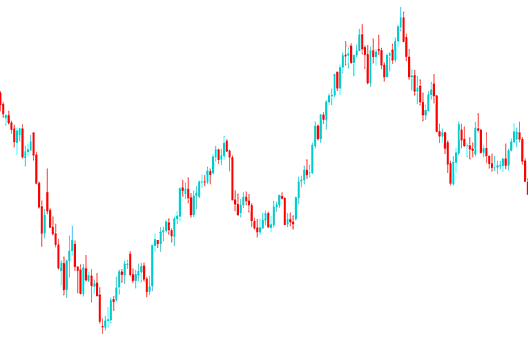
EUR USD
USDX compared with the EURUSD chart
The image below overlays the US Index on a EURUSD chart. It shows their opposite link. Signals from one go against the other's trend. Traders use this reverse tie to predict EURUSD moves with USDX.
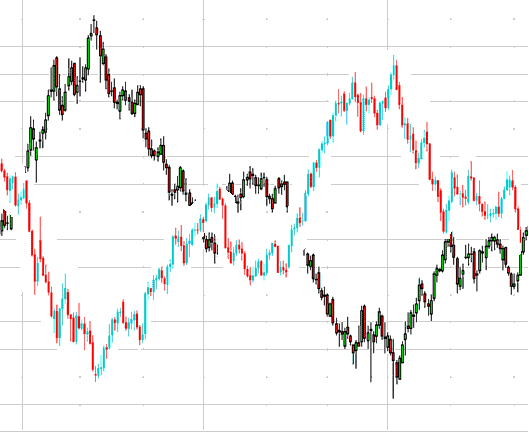
USDX compared with EURUSD
Access Extra Tutorials and Lessons
- Index Trade Strategy Lesson
- How to Calculate Pips For SX 5E Indices
- No-Nonsense Tutorials and Website Training Guides
- How Do I Trade Strategy Signals?
- Best Method to Trade DAX 30 Index
- How is SX5E Index Traded in the MetaTrader 4 and MT5 Platform?
- What's XAU USD Signals Meaning?
- One Pip Size for Dow Jones 30 Indices
- Where to Locate a MT4 SMI 20 Index Chart?
- How to Set US 100 in MT5 Android App