RVI Technical Analysis & Relative Vigor Index Signals
Created and Developed by John Ehler
The RVI blends classic technical analysis with modern digital signal processing and filters, creating a practical indicator for traders.
The fundamental concept behind it is straightforward -
- Prices tend to close higher than where they open in up-trending markets and
- Prices close lower than where they open in down-trending markets.
Therefore, the movement's strength will be determined by the closing price of the candlestick. The RVI consists of two lines: the signal line and the RVI line.
The RVI index fundamentally measures the average difference between closing and opening prices, and this value is then averaged with the mean daily range and plotted.
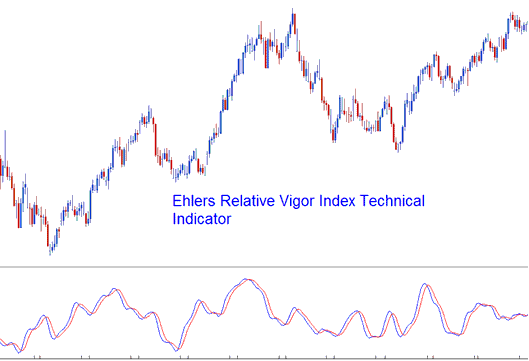
This characteristic makes the index a responsive oscillator technical indicator, capable of quick transitions that align with market price cycles.
Technical Analysis and How to Generate Trading Signals
The RVI is classified as an oscillator indicator. The primary method for interpreting this index involves observing the intersection points between the RVI line and its corresponding Signal Line. Trading signals are generated precisely at these crossovers.
Bullish Signals - A buy signal manifests when the RVI indicator crosses above its associated Signal-Line.
Bearish Signals - a sell trade signal happens when the RVI crosses below the Signal-Line.
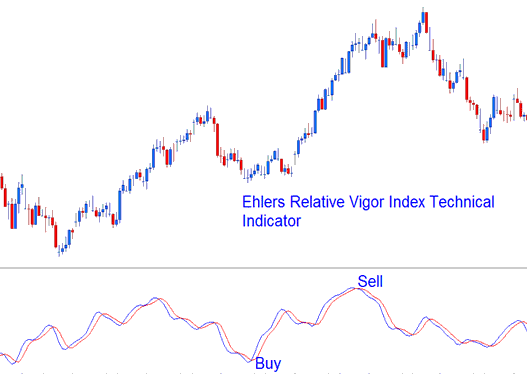
Buy and sell signals generated using the crossover trading strategy
Explore Additional Topics and Tutorials:
- How to Find and Get MT4 USD DKK Chart
- UsTec 100 MetaTrader 4 US TEC 100 Trading Program
- Forex Choppiness Index Expert Advisor Setup
- Using Alligator Technical Ideas in Forex Trading
- What is the Way to Create a Practice Account on MetaTrader 4?
- How Do I Place Fractals Trading Indicator in XAU USD Chart on MT4 Software/Platform?
- Guide to Calculating and Interpreting Pips for the NZD/JPY Currency Pair
- List of FTSE Trading Method
- What is Index in Trade?
- Utilizing the Kase Peak Oscillator Indicator within MetaTrader 5