Pivot Points MetaTrader 4 Indicator & Pivot Points Signals
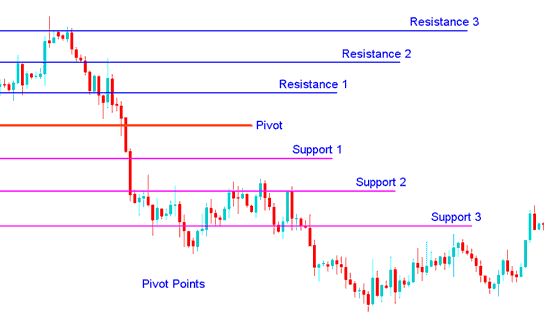
Pivot points consist of a central pivot level surrounded by three support levels below it and three resistance levels above it. This indicator originally used by floor traders on equity and futures exchanges because they provided a quick way for those traders to get a general idea of how the market was moving during the course of the day using only a few simple calculations. However, over time these levels have also proved exceptionally useful in other markets as well.
One of the reasons that makes this indicator is now so popular is because they are considered a "leading" (or predictive) indicator rather than lagging. All that is required to calculate the levels for the upcoming (current) trading day is the previous day high, low, and close prices. These levels are calculated according to the following formulas:
The central pivot can then be used to calculate the support & resistance areas as follows:
Resistance 1
Resistance 2
Resistance 3
Support 1
Support 2
Support 3
Explanation
Pivot points can be used in many different ways. Here are a few of the most common methods for utilizing them.
FX Trading Trend Direction:
Combined with other MetaTrader 4 Indicator techniques such as overbought/oversold MetaTrader 4 Indicators, volatility measurements, etc., the central pivot may be useful in determining the general trending direction of the market. Trades are only taken in the direction of the trend. Buy trades occur only when the price is above the central point and sell trades occur only when the price is below the central point.
Forex Trading Price Breakouts:
When trading price breakouts, a buy signal occurs when the price breaks up through the central pivot or one of the resistance levels (typically Resistance 1). A sell signal occurs when price breaks down through the central pivot or one of the support levels (typically Support 1).
FX Trading Price Reversals:
When trading price reversals, a buy signal occurs when the price moves towards a support level, gets very close to it, touches it, or moves only slightly through it, and then reverses and moves back in the opposite direction. A sell signal occurs when the price moves towards a resistance level, gets very close to it, touches it, or moves only slightly through it, and then reverses and moves back in opposite direction.
Forex Stop Loss and FX Limit Profit Values Determined by Support/Resistance Levels Forex Indicator:
The central pivot & its support & resistance levels may be potentially helpful in determining suitable stoploss &/or limit profit placements. For example, if trading a long breakout above the Resistance 1 level it might be reasonable to position a stop loss order just below the central point and one or more limit profit(s) orders at the Resistance 2 and/or Resistance 3 levels.
To download Pivot points:
https://c.mql5.com/21/9/pro4x_pivot_lines.mq4
Once you download it open it with MQL4 Language Meta Editor, Then Compile the technical indicator by pressing Compile Button and it'll be added to your MT4.
Note: Once you add it to your MT4, the technical indicator has additional lines named MidPoints, to remove the additional lines open MQL4 Meta Editor(shortcut keyboard key - press F4), & change line 16 from:
Extern bool midpivots = true:
To
Extern bool midpivots = false:
Then Press Compile again, and it will then appear as exactly illustrated on www.tradeforextrading.com website.


