How Do You Use Fibonacci Retracement Levels for Day Trading?
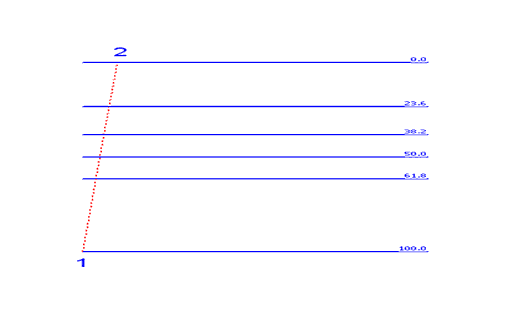
The Fibonacci retracements are explained below: traders should use this Fibonacci Retracement Levels indicator to figure out where to open a trade whether a buy bitcoin trade in a up bitcoin trend and a sell bitcoin trade in a downwards trend.
How Do You Use Fibo Retracement Levels for Day Trading?

How Do You Use Fibo Retracement Levels for Intra-day Trading?
How Do I Use Fibonacci Retracement Levels for Day Trading? - Fibonacci Retracement Tool Described

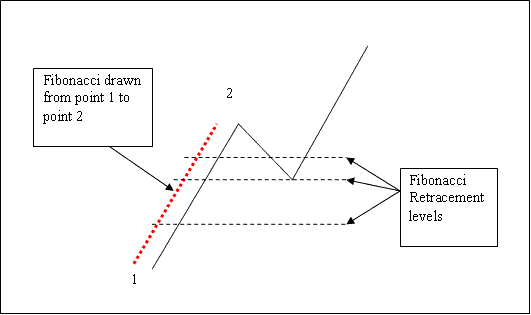
How Do You Use Fibonacci Retracement Levels for Intra-day Trading? - Fibo Retracement Tool Illustrated
How Do I Use Bitcoin Trading Fibo Retracement?
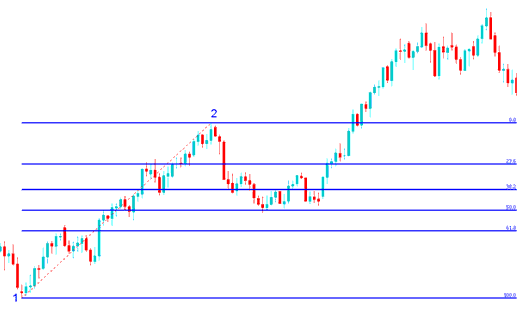
In the technical analysis example illustrated below the bitcoin price is heading up between chart point 1 and chart point two then after chart point two it retraces down to 50.0 % retracement level then bitcoin price continues moving up in the original and initial upwards trend. Note that this retracement indicator is plotted from point 1 to point 2 in direction of the Bitcoin trend (Up-wards Direction).

Analysis of How to Use Fibonacci Retracement on an Up BTC/USD Crypto Trend
Analysis of How to Use Fibo Retracement in an Up BTC/USD Crypto Trend
Once the bitcoin price hit the 50.0% retracement area, this retracement level provided a lot of support for the bitcoin trading price, and afterwards btcusd trading market then resumed the original upwards bitcoin trend & continued to move up.
For this trading analysis exemplification, the bitcoin price retracement reached the 50.00 % retracement area, but most of the time the bitcoin trading market will retrace up to 38.2% retracement level & therefore most of the time bitcoin traders set their buy limit bitcoin orders at the 38.2% Fib retracement level, & at the same time placing and setting a stop just below 61.8 % Fib retracement area.
How Do I Use Bitcoin Trading Fib Retracement?
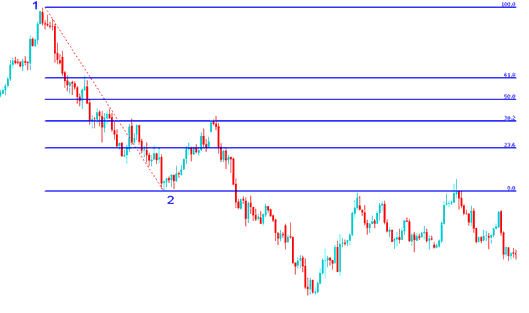
In the Bitcoin Retracement Strategy Method example shown below the btcusd trading market is moving down between chart point 1 & chart point 2, then after chart point two the bitcoin price then retraces upto 38.2% retracement level then it continues moving and going downwards in the original downwards trend. Note that this retracement indicator is plotted from point 1 to point 2 in direction of the Bitcoin trend (Downwards Direction).

Analysis of How to Use Fibonacci Retracement on a Down BTCUSD Trend
Analysis of How to Use Fibo Retracement on a Down Bitcoin Trend
The above technical analysis examples is a retracement setup where the bitcoin price retraces immediately after touching the 38.2 % Chart Fibonacci Retracement Level.
In this trading analysis example the retracement of bitcoin price reached 38.20% retracement level & didn't get to 50.00 % retracement level. It is always good to use 38.20 percent retracement level because most times the bitcoin price retracement does not always get to 50.00 percent retracement area.
This Bitcoin Retracement level provided a lot of resistance for the bitcoin price retracement, this was the best place for a trader to set a sell limit bitcoin order as the btcusd market quickly headed down after hitting this price retracement area.
More Guides & Tutorials:
- How Do I Install MT4 Bitcoin Platform/Software in a Computer PC Desktop?
- How Do I Use TP BTC/USD Orders & Set SL BTC/USD Orders in MT4 Platform Software?
- How to Interpret and Analyze BTC USD Upward Trend Channels in BTC USD Trade
- Trade BTC USD Using Pivot Points BTC/USD Indicator
- How Do You Set Stop Loss BTC USD Order & Take-Profit BTC USD Order on MT4 Software Platform?
- How to Analyze and Analyze BTC USD Trade Chart Using BTC/USD Trend
- How Do I Draw Downwards Bitcoin Trend-Lines in MT5 BTCUSD Charts?
- How Do You Add MT5 BTCUSD Relative Vigor Index, RVI BTC/USD Trading Indicator in Chart RVI Bitcoin Trading Indicator?
- How Do You Trade BTC USD in MT4 iPad App?
- BTC USD Trade Psychology Explained


